 PostGIS
 Mobile
 QGIS
QGIS MapBender
 GeoServer
 GeoNode
 GeoNetwork
 Solutions


116 lines
3.0 KiB
Markdown
116 lines
3.0 KiB
Markdown
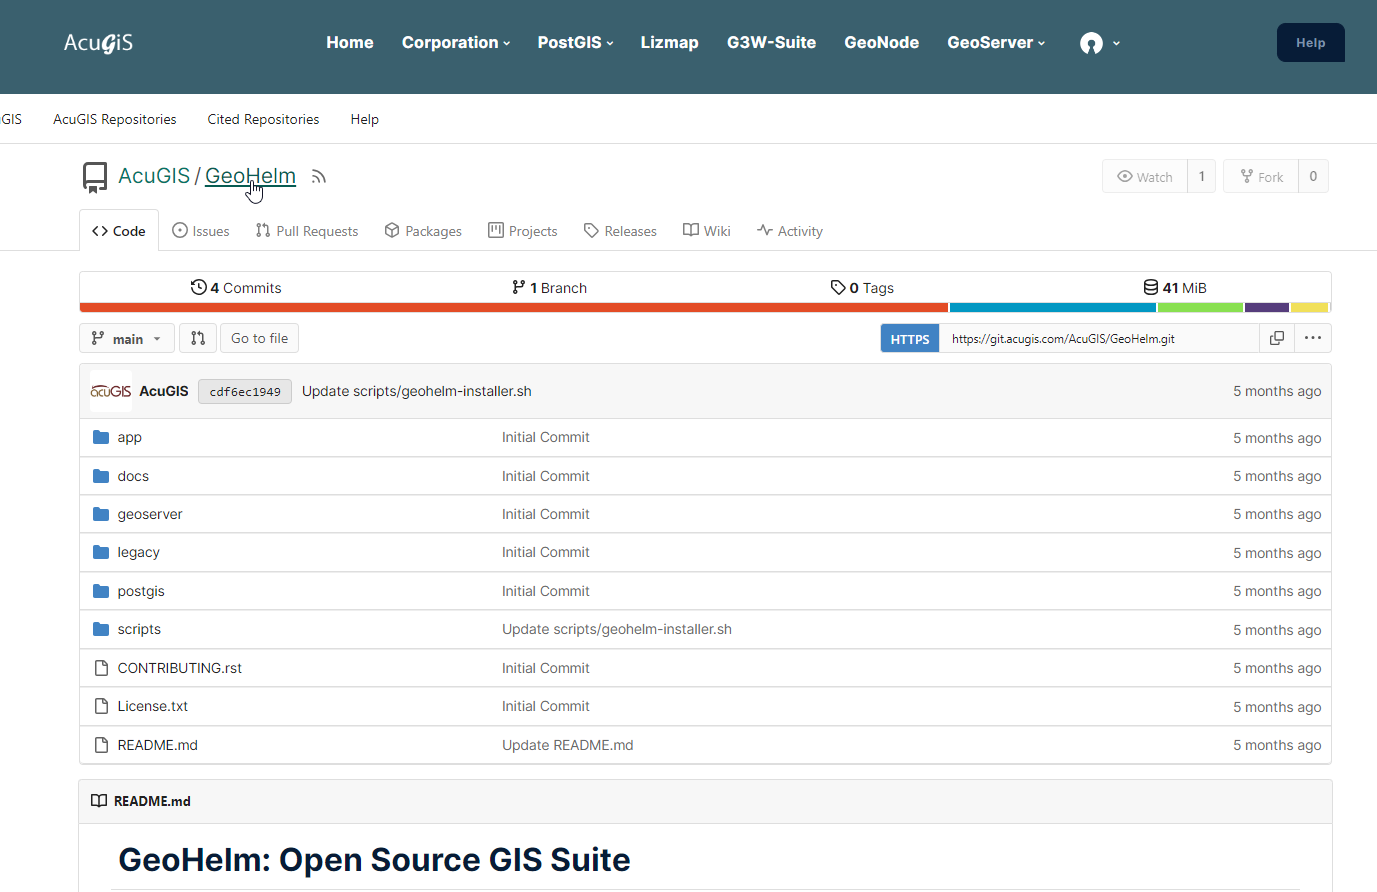
# Hot Spot Analysis Worker
|
|
|
|
Processes hot spot analysis jobs using Getis-Ord Gi* statistics.
|
|
|
|
## Overview
|
|
|
|
The hot spot analysis worker identifies statistically significant clusters of high and low values in spatial data using the Getis-Ord Gi* statistic.
|
|
|
|
## Job Type
|
|
|
|
`hotspot_analysis`
|
|
|
|
## Input Parameters
|
|
|
|
```json
|
|
{
|
|
"dataset_id": 123,
|
|
"value_field": "population",
|
|
"neighbor_type": "distance",
|
|
"distance": 1000,
|
|
"output_mode": "static"
|
|
}
|
|
```
|
|
|
|
### Parameters
|
|
|
|
- `dataset_id` (required): Source dataset ID
|
|
- `value_field` (required): Numeric field to analyze
|
|
- `neighbor_type` (optional): "distance" or "knn" (default: "distance")
|
|
- `distance` (required if neighbor_type="distance"): Distance threshold in dataset units
|
|
- `k_neighbors` (required if neighbor_type="knn"): Number of nearest neighbors
|
|
- `output_mode` (optional): "static", "view", or "materialized_view" (default: "static")
|
|
|
|
## Output
|
|
|
|
Creates a new dataset with hot spot analysis results:
|
|
|
|
- **Gi* Z-Score**: Standardized z-score indicating hot/cold spots
|
|
- **P-Value**: Statistical significance
|
|
- **Hot Spot Class**: Categorized classes (99% hot, 95% hot, 90% hot, not significant, 90% cold, 95% cold, 99% cold)
|
|
|
|
## Output Modes
|
|
|
|
### Static Table (default)
|
|
|
|
Results stored in a permanent table `spatial_data_{output_id}`. Best for:
|
|
- Final results that won't change
|
|
- Maximum query performance
|
|
- Historical snapshots
|
|
|
|
### View
|
|
|
|
Results stored as a database view. Best for:
|
|
- Results that should update when source data changes
|
|
- Real-time analysis
|
|
- Reduced storage requirements
|
|
|
|
### Materialized View
|
|
|
|
Results stored as a materialized view. Best for:
|
|
- Large datasets requiring periodic refresh
|
|
- Balance between performance and freshness
|
|
- Scheduled updates
|
|
|
|
## Algorithm
|
|
|
|
The worker uses PostGIS functions to:
|
|
|
|
1. Calculate spatial weights matrix based on neighbor type
|
|
2. Compute Getis-Ord Gi* statistic for each feature
|
|
3. Calculate z-scores and p-values
|
|
4. Categorize results into hot spot classes
|
|
5. Store results in output table/view
|
|
|
|
## Example
|
|
|
|
```bash
|
|
# Enqueue a hot spot analysis job via API
|
|
curl -X POST "https://example.com/api/analysis_hotspot_run.php" \
|
|
-H "Content-Type: application/json" \
|
|
-d '{
|
|
"dataset_id": 123,
|
|
"value_field": "population",
|
|
"neighbor_type": "distance",
|
|
"distance": 1000
|
|
}'
|
|
|
|
# Worker processes the job automatically
|
|
# Check status via API
|
|
curl "https://example.com/api/job_status.php?job_id=456"
|
|
```
|
|
|
|
## Background Jobs
|
|
|
|
This analysis runs as a background job. The worker:
|
|
|
|
1. Fetches queued `hotspot_analysis` jobs
|
|
2. Validates input parameters
|
|
3. Executes PostGIS analysis queries
|
|
4. Creates output dataset
|
|
5. Marks job as completed
|
|
|
|
## Performance Considerations
|
|
|
|
- Processing time depends on dataset size and neighbor configuration
|
|
- Distance-based analysis may be slower for large datasets
|
|
- KNN-based analysis is generally faster
|
|
- Consider using materialized views for very large datasets
|
|
|
|
## Related Documentation
|
|
|
|
- [Hot Spot Analysis Tool](../analysis-tools/hotspot.md)
|
|
- [Analysis API](../api/analysis.md)
|
|
- [Workers Overview](index.md)
|
|
|
