 PostGIS
 Mobile
 QGIS
QGIS MapBender
 GeoServer
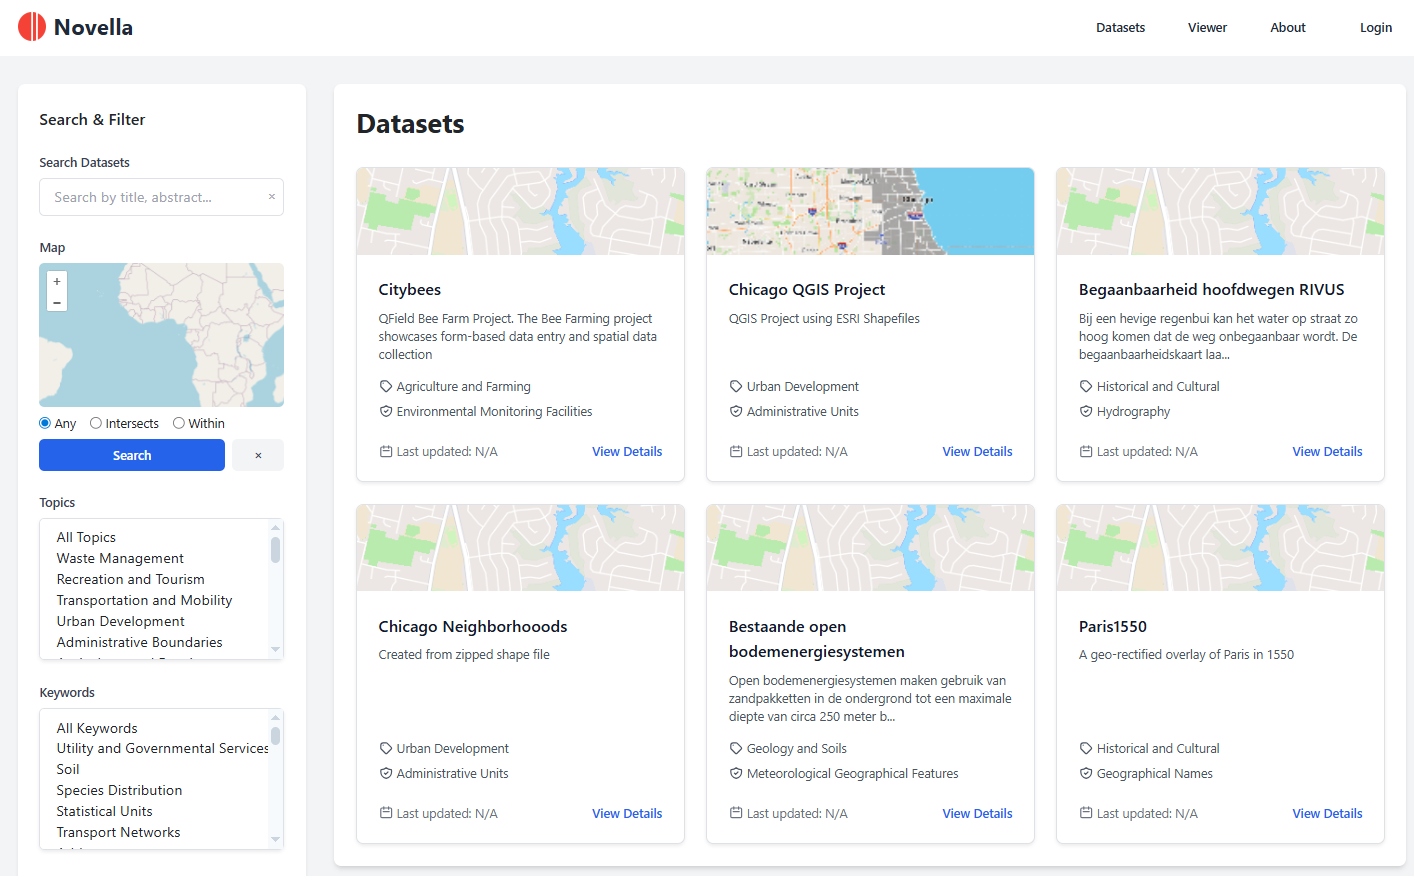
 GeoNode
 GeoNetwork
 Solutions


1.4 KiB
1.4 KiB
Kernel Density Estimation (KDE)
Generate density surfaces from point data using kernel density estimation.
Overview
KDE creates a continuous density surface from point data, showing where points are concentrated. Higher values indicate greater point density.
Inputs
- Dataset: Point dataset
- Bandwidth: Smoothing parameter (default: auto-calculated)
- Cell Size: Output raster cell size (default: auto-calculated)
- Weight Field (optional): Field to weight points
Outputs
Raster dataset containing:
- Density values for each cell
- Higher values indicate greater point density
- Proper spatial reference
Algorithm
- Calculate optimal bandwidth (if not specified)
- Create output raster grid
- For each cell, calculate kernel-weighted sum of nearby points
- Store density values in raster
Example
{
  "dataset_id": 123,
  "bandwidth": 1000,
  "cell_size": 100
}
Background Jobs
This analysis runs as a background job.
Use Cases
- Population density mapping
- Crime hotspot visualization
- Species distribution modeling
- Event density analysis
Notes
- Bandwidth controls smoothing (larger = smoother)
- Cell size controls output resolution
- Weight field allows importance weighting
- Results are sensitive to bandwidth selection
