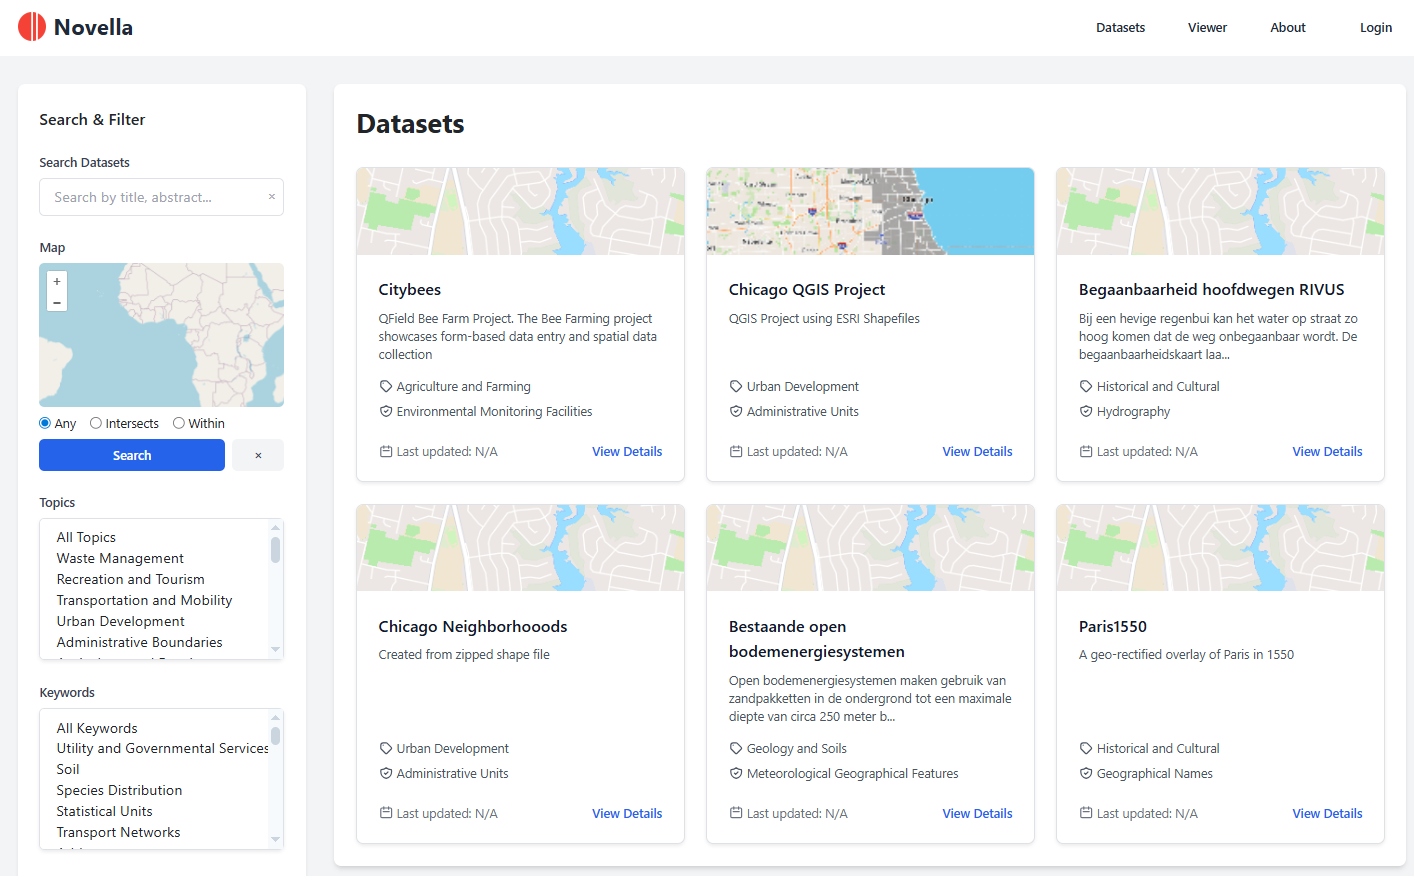
 PostGIS
 Mobile
 QGIS
QGIS MapBender
 GeoServer
 GeoNode
 GeoNetwork
 Solutions


52 lines
948 B
Markdown
52 lines
948 B
Markdown
# Raster Histogram
|
|
|
|
Analyze pixel value distributions in raster datasets.
|
|
|
|
## Overview
|
|
|
|
Raster histogram analysis generates histograms showing the distribution of pixel values in raster datasets.
|
|
|
|
## Inputs
|
|
|
|
- **Raster Dataset**: Raster dataset to analyze
|
|
- **Band** (optional): Band to analyze (default: first band)
|
|
- **Bins** (optional): Number of histogram bins
|
|
|
|
## Outputs
|
|
|
|
Histogram data containing:
|
|
|
|
- Value ranges for each bin
|
|
- Pixel counts for each bin
|
|
- Statistics (min, max, mean, median)
|
|
|
|
## Example
|
|
|
|
```json
|
|
{
|
|
"raster_dataset_id": 125,
|
|
"band": 1,
|
|
"bins": 256
|
|
}
|
|
```
|
|
|
|
## Use Cases
|
|
|
|
- Data distribution analysis
|
|
- Quality assessment
|
|
- Value range identification
|
|
- Visualization preparation
|
|
|
|
## Notes
|
|
|
|
- NoData values excluded
|
|
- Results depend on raster data type
|
|
- Bins affect histogram resolution
|
|
- Large rasters may take time to process
|
|
|
|
## Related Documentation
|
|
|
|
- [Analysis API](../api/analysis.md)
|
|
- [Raster Tools](raster.md)
|
|
|
