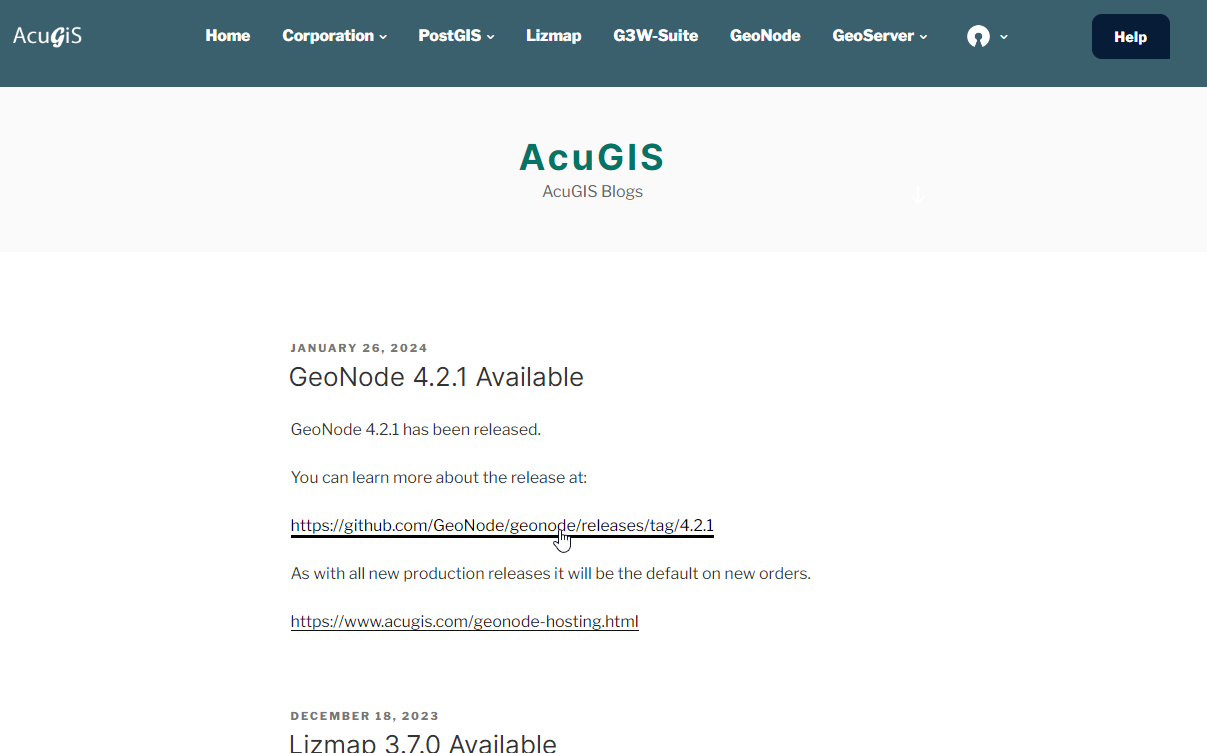
 PostGIS
 Mobile
 QGIS
QGIS MapBender
 GeoServer
 GeoNode
 GeoNetwork
 Solutions


89 lines
1.5 KiB
Markdown
89 lines
1.5 KiB
Markdown
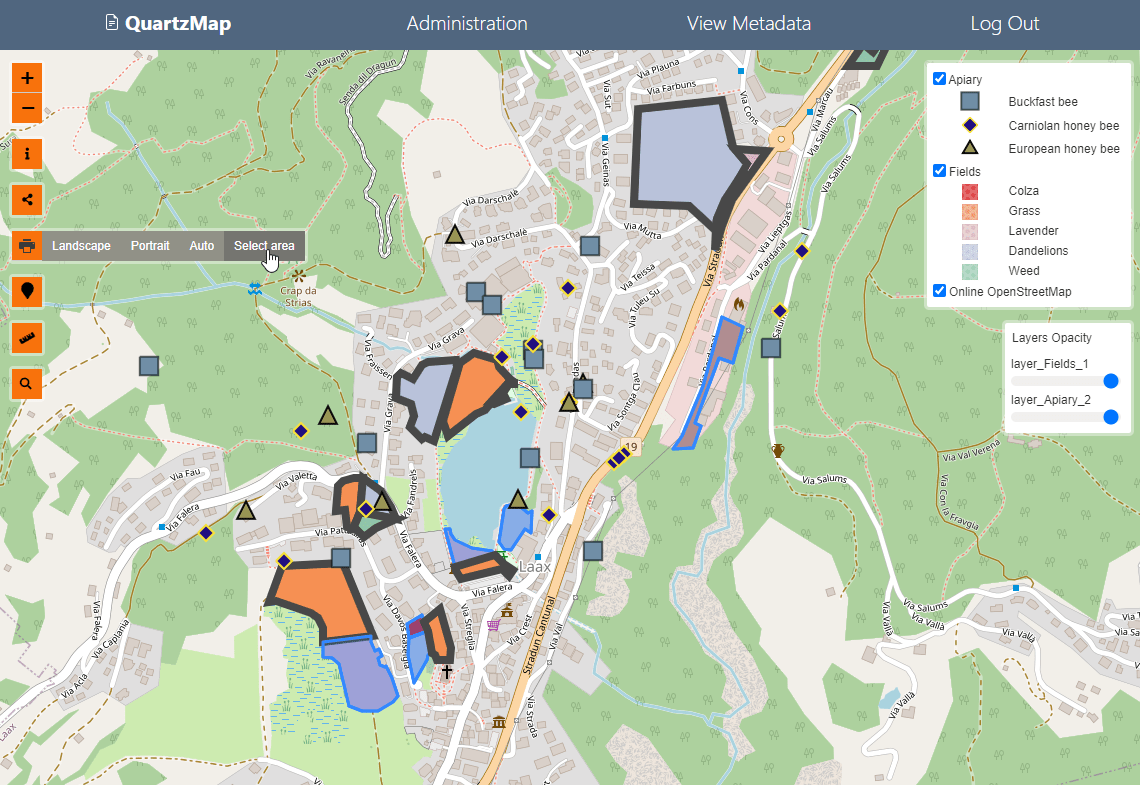
# Map Viewer
|
|
|
|
The map viewer provides an interactive mapping interface for visualizing spatial data.
|
|
|
|
## Overview
|
|
|
|
The map viewer (`view_map.php`) displays multiple datasets on an interactive map with full analysis capabilities.
|
|
|
|
## Features
|
|
|
|
### Map Display
|
|
|
|
- Multiple basemap options
|
|
- Layer management
|
|
- Zoom and pan controls
|
|
- Feature identification
|
|
- Coordinate display
|
|
- Scale bar
|
|
|
|
### Layer Management
|
|
|
|
- Add/remove layers
|
|
- Layer visibility toggle
|
|
- Layer opacity control
|
|
- Layer ordering
|
|
- Layer grouping
|
|
|
|
### Styling
|
|
|
|
- Point styling
|
|
- Line styling
|
|
- Polygon styling
|
|
- Graduated colors
|
|
- Categorical colors
|
|
- Custom styles
|
|
|
|
### Analysis Tools
|
|
|
|
Integrated analysis panel with:
|
|
|
|
- Hot spot analysis
|
|
- Outlier detection
|
|
- KDE (Kernel Density Estimation)
|
|
- Clustering
|
|
- Buffer analysis
|
|
- Nearest neighbor
|
|
- Overlay operations
|
|
- Raster tools
|
|
|
|
## Basemaps
|
|
|
|
Available basemap options:
|
|
|
|
- OpenStreetMap
|
|
- CartoDB Positron
|
|
- CartoDB Dark Matter
|
|
- CartoDB Voyager
|
|
- ESRI World Imagery
|
|
- Custom WMS layers
|
|
|
|
## Interaction
|
|
|
|
### Feature Identification
|
|
|
|
- Click features to view details
|
|
- Popup display with attributes
|
|
- Link to feature detail pages
|
|
|
|
### Drawing Tools
|
|
|
|
- Draw polygons for clipping
|
|
- Draw lines for profiles
|
|
- Draw points for analysis
|
|
- Measure distances and areas
|
|
|
|
### Spatial Queries
|
|
|
|
- Query by location
|
|
- Query by attributes
|
|
- Spatial filters
|
|
- Buffer queries
|
|
|
|
## Related Documentation
|
|
|
|
- [Dataset Viewer](dataset-viewer.md)
|
|
- [Analysis Panel](analysis-panel.md)
|
|
- [Dashboard Builder](dashboard-builder.md)
|
|
|
