 PostGIS
 Mobile
 QGIS
QGIS MapBender
 GeoServer
 GeoNode
 GeoNetwork
 Solutions


258 lines
5.4 KiB
Markdown
258 lines
5.4 KiB
Markdown
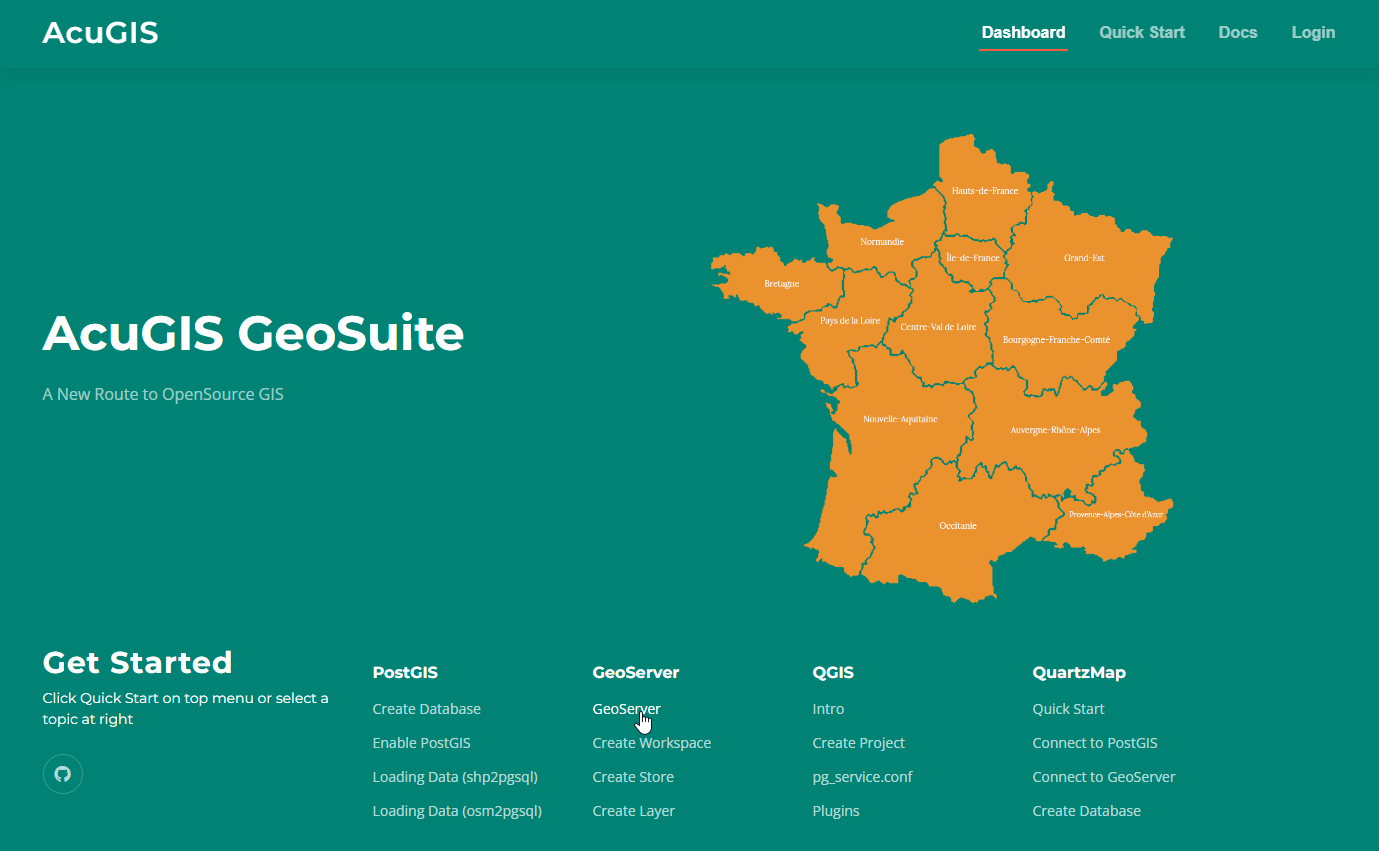
# Dashboard
|
|
|
|
Create custom interactive dashboards with multiple widgets to visualize and analyze spatial data.
|
|
|
|
## Overview
|
|
|
|
Dashboards provide a flexible, drag-and-drop interface for building custom data visualization layouts. Combine maps, charts, tables, and analysis widgets to create comprehensive data views.
|
|
|
|
## Creating Dashboards
|
|
|
|
### Access
|
|
|
|
- Navigate to Dashboard Builder (`dashboard_builder.php`)
|
|
- Only admins can create new dashboards
|
|
- Users with edit permissions can modify existing dashboards
|
|
|
|
### Building Process
|
|
|
|
1. **Add Widgets**: Drag widgets from the sidebar onto the canvas
|
|
2. **Configure Widgets**: Click widgets to configure data sources and settings
|
|
3. **Arrange Layout**: Drag widgets to reposition, resize from corners
|
|
4. **Save Dashboard**: Save configuration and assign permissions
|
|
|
|
## Widget Types
|
|
|
|
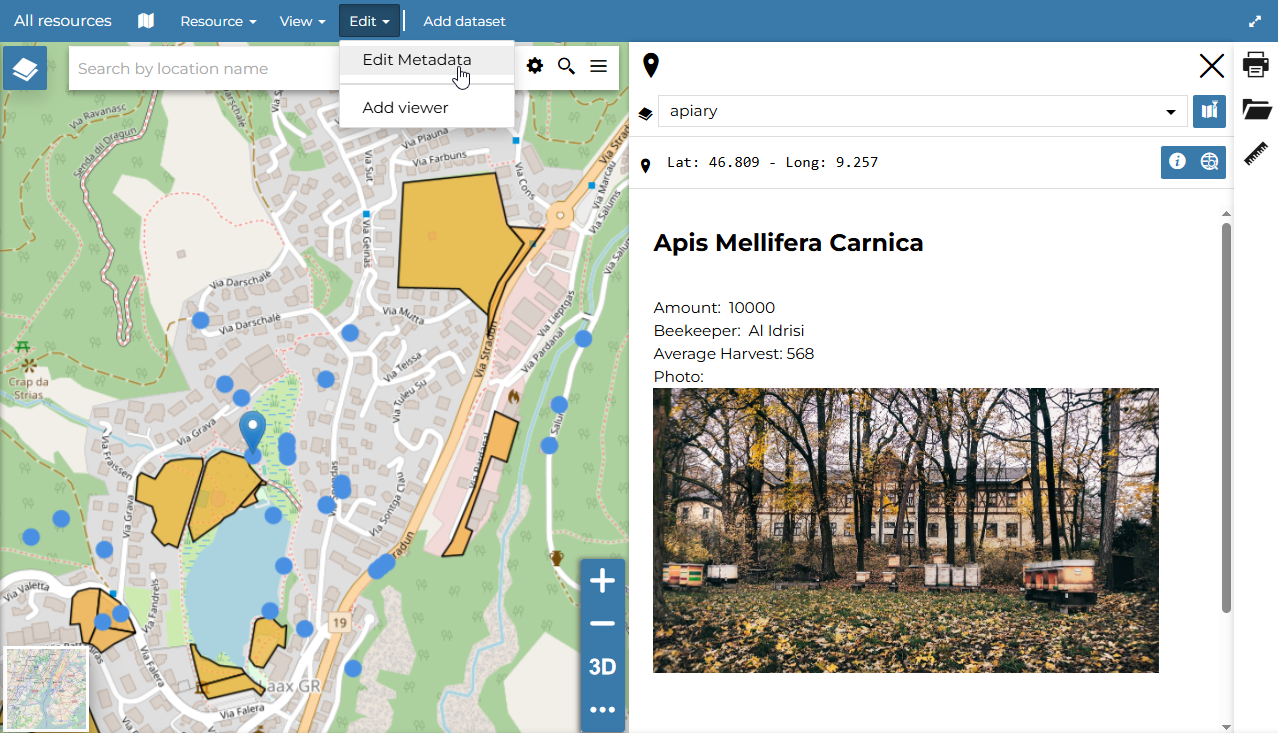
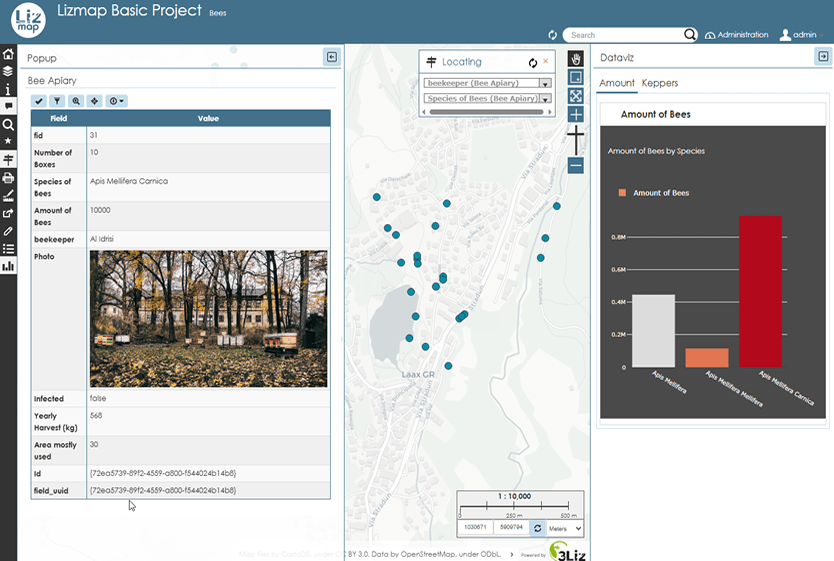
### Map Widget
|
|
|
|
Interactive map display with multiple layers.
|
|
|
|
**Configuration**:
|
|
- Dataset selection
|
|
- Basemap selection
|
|
- Layer styling
|
|
- Initial extent
|
|
- Interaction settings
|
|
|
|
**Features**:
|
|
- Pan and zoom
|
|
- Feature identification
|
|
- Layer visibility toggle
|
|
- Popup configuration
|
|
|
|
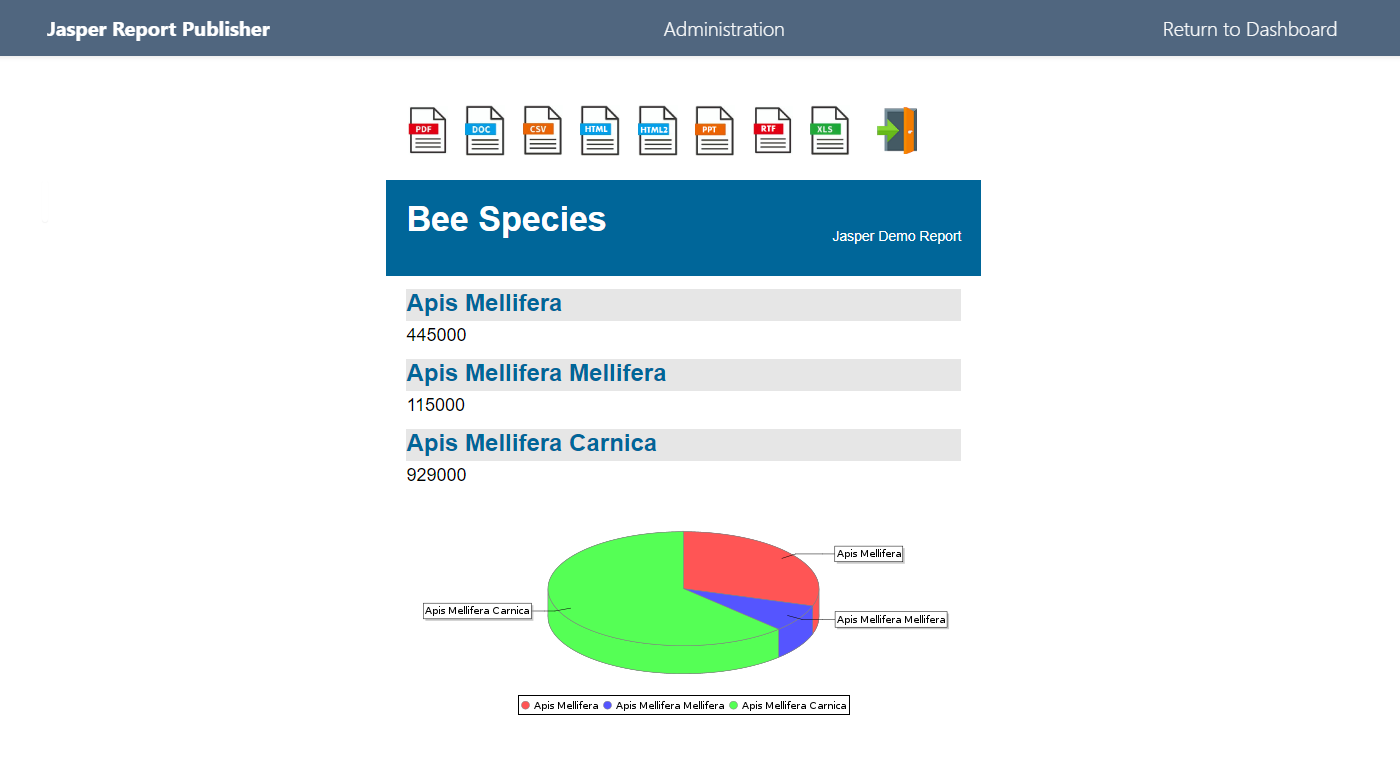
### Chart Widget
|
|
|
|
Data visualization charts.
|
|
|
|
**Chart Types**:
|
|
- **Bar Chart**: Categorical comparisons
|
|
- **Line Chart**: Time series or trends
|
|
- **Pie Chart**: Proportional data
|
|
- **Scatter Plot**: Correlation analysis
|
|
|
|
**Configuration**:
|
|
- Dataset selection
|
|
- X and Y axis fields
|
|
- Aggregation functions
|
|
- Chart styling
|
|
- Update intervals
|
|
|
|
### Table Widget
|
|
|
|
Data table display with sorting and filtering.
|
|
|
|
**Features**:
|
|
- Column selection
|
|
- Sorting by columns
|
|
- Filtering
|
|
- Pagination
|
|
- Export options
|
|
|
|
**Configuration**:
|
|
- Dataset selection
|
|
- Visible columns
|
|
- Default sort
|
|
- Page size
|
|
- Row limit
|
|
|
|
### Counter Widget
|
|
|
|
Display summary statistics.
|
|
|
|
**Functions**:
|
|
- **Count**: Number of features
|
|
- **Sum**: Sum of numeric values
|
|
- **Average**: Mean value
|
|
- **Min/Max**: Minimum/maximum values
|
|
|
|
**Configuration**:
|
|
- Dataset selection
|
|
- Calculation function
|
|
- Value field (for sum/avg/min/max)
|
|
- Filter conditions
|
|
- Formatting options
|
|
|
|
### Filter Widget
|
|
|
|
Dataset filter controls for interactive filtering.
|
|
|
|
**Filter Types**:
|
|
- **Property Filters**: Filter by attribute values
|
|
- **Spatial Filters**: Filter by location
|
|
- **Date Filters**: Filter by date ranges
|
|
- **Numeric Filters**: Filter by numeric ranges
|
|
|
|
**Features**:
|
|
- Synchronize filters across widgets
|
|
- Real-time updates
|
|
- Save filter presets
|
|
- Clear filters
|
|
|
|
### Vector Analysis Widget
|
|
|
|
Tabular statistics for vector datasets.
|
|
|
|
**Statistics**:
|
|
- Feature count
|
|
- Geometry type distribution
|
|
- Attribute summaries
|
|
- Spatial extent
|
|
|
|
**Configuration**:
|
|
- Dataset selection
|
|
- Statistics to display
|
|
- Grouping options
|
|
|
|
### Raster Analysis Widget
|
|
|
|
Tabular statistics for raster datasets.
|
|
|
|
**Statistics**:
|
|
- Pixel count
|
|
- Value ranges
|
|
- Band information
|
|
- NoData statistics
|
|
|
|
**Configuration**:
|
|
- Raster dataset selection
|
|
- Statistics to display
|
|
- Band selection
|
|
|
|
### Hot Spot Summary Widget
|
|
|
|
Hot spot analysis summary statistics.
|
|
|
|
**Information**:
|
|
- Total features analyzed
|
|
- Hot spot count by class
|
|
- Cold spot count by class
|
|
- Significance distribution
|
|
|
|
**Configuration**:
|
|
- Hot spot dataset selection
|
|
- Class breakdown
|
|
- Summary format
|
|
|
|
### Outlier Summary Widget
|
|
|
|
Outlier analysis summary statistics.
|
|
|
|
**Information**:
|
|
- Total features
|
|
- Outlier count
|
|
- Outlier percentage
|
|
- Method used (z-score/MAD)
|
|
|
|
**Configuration**:
|
|
- Outlier dataset selection
|
|
- Summary format
|
|
|
|
## Dashboard Features
|
|
|
|
### Layout Management
|
|
|
|
- **Drag and Drop**: Reposition widgets by dragging
|
|
- **Resize**: Resize widgets from corners
|
|
- **Grid System**: Snap to grid for alignment
|
|
- **Responsive**: Adapts to different screen sizes
|
|
|
|
### Configuration
|
|
|
|
- **Widget Settings**: Configure each widget individually
|
|
- **Data Sources**: Link widgets to datasets
|
|
- **Styling**: Customize colors, fonts, sizes
|
|
- **Update Intervals**: Set refresh rates for live data
|
|
|
|
### Sharing and Permissions
|
|
|
|
- **Public Dashboards**: Share via public URL
|
|
- **Access Control**: Set permissions per user/group
|
|
- **Embed Codes**: Embed dashboards in external sites
|
|
- **Export**: Export dashboard configuration
|
|
|
|
### Viewing Dashboards
|
|
|
|
- **Full Screen**: View dashboards in full-screen mode
|
|
- **Print**: Print-friendly layouts
|
|
- **Export**: Export dashboard as image/PDF
|
|
- **Mobile**: Responsive mobile views
|
|
|
|
## Use Cases
|
|
|
|
### Data Monitoring
|
|
|
|
- Real-time data monitoring
|
|
- Key performance indicators
|
|
- Status dashboards
|
|
- Alert systems
|
|
|
|
### Analysis Results
|
|
|
|
- Analysis result displays
|
|
- Statistical summaries
|
|
- Trend visualizations
|
|
- Comparative analysis
|
|
|
|
### Public Portals
|
|
|
|
- Public data portals
|
|
- Community dashboards
|
|
- Open data displays
|
|
- Information kiosks
|
|
|
|
### Executive Summaries
|
|
|
|
- High-level overviews
|
|
- Executive reports
|
|
- Strategic dashboards
|
|
- Performance metrics
|
|
|
|
## Example Dashboard
|
|
|
|
A typical dashboard might include:
|
|
|
|
1. **Map Widget**: Showing geographic distribution
|
|
2. **Counter Widgets**: Key statistics (total features, average values)
|
|
3. **Chart Widget**: Trend analysis over time
|
|
4. **Table Widget**: Detailed data view
|
|
5. **Filter Widget**: Interactive filtering controls
|
|
|
|
## API Access
|
|
|
|
Dashboards can be accessed programmatically:
|
|
|
|
```bash
|
|
# View dashboard
|
|
GET /view_dashboard.php?id={dashboard_id}
|
|
|
|
# Dashboard API
|
|
GET /dashboard_api.php?action=get&id={dashboard_id}
|
|
```
|
|
|
|
## Related Documentation
|
|
|
|
- [Dashboard Builder UI](../ui/dashboard-builder.md)
|
|
- [Map Viewer](../ui/map-viewer.md)
|
|
- [Analysis Tools](../analysis-tools/index.md)
|
|
|
