 PostGIS
 Mobile
 QGIS
QGIS MapBender
 GeoServer
 GeoNode
 GeoNetwork
 Solutions


42 lines
1.0 KiB
Markdown
42 lines
1.0 KiB
Markdown
# User Interface Components
|
|
|
|
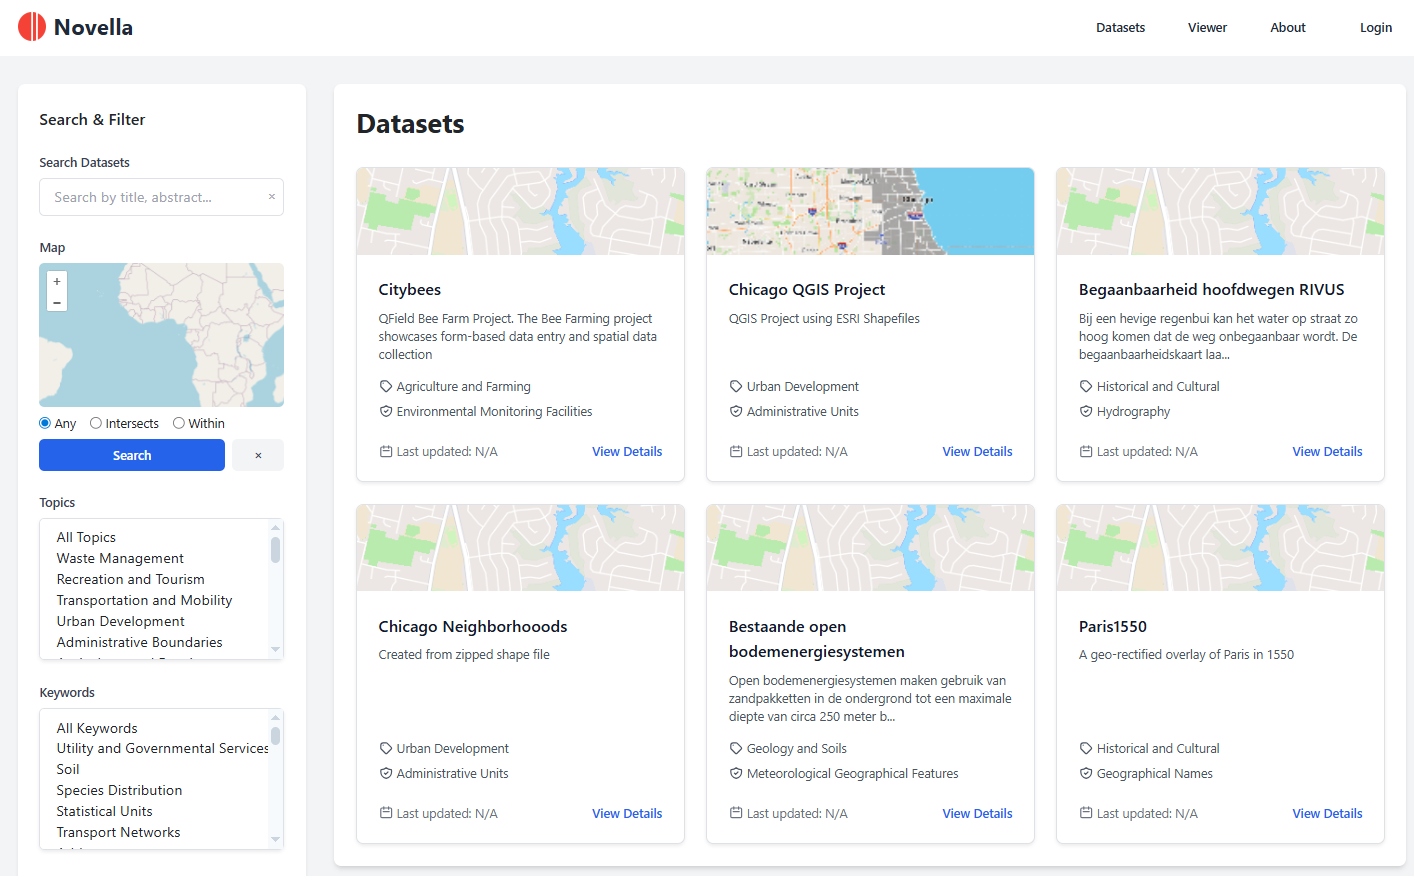
Aurora GIS provides a comprehensive web-based interface for managing, analyzing, and visualizing spatial data.
|
|
|
|
## Overview
|
|
|
|
The user interface is built with:
|
|
|
|
- **Bootstrap 5**: Responsive UI framework
|
|
- **Leaflet.js**: Interactive mapping
|
|
- **OpenLayers**: Advanced mapping capabilities
|
|
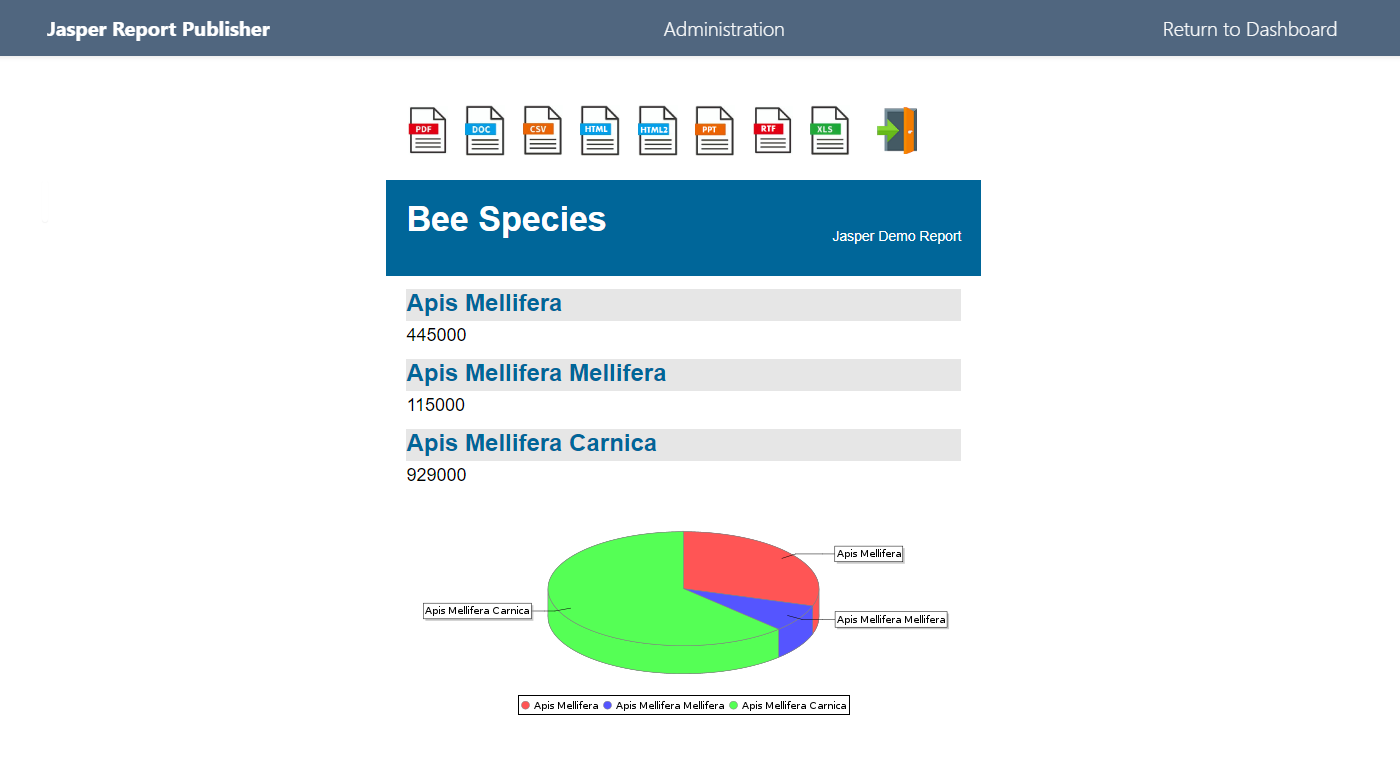
- **Chart.js / Plotly**: Data visualization
|
|
- **Modern JavaScript**: ES6+ features
|
|
|
|
## Main Components
|
|
|
|
```{toctree}
|
|
:maxdepth: 2
|
|
|
|
dataset-viewer
|
|
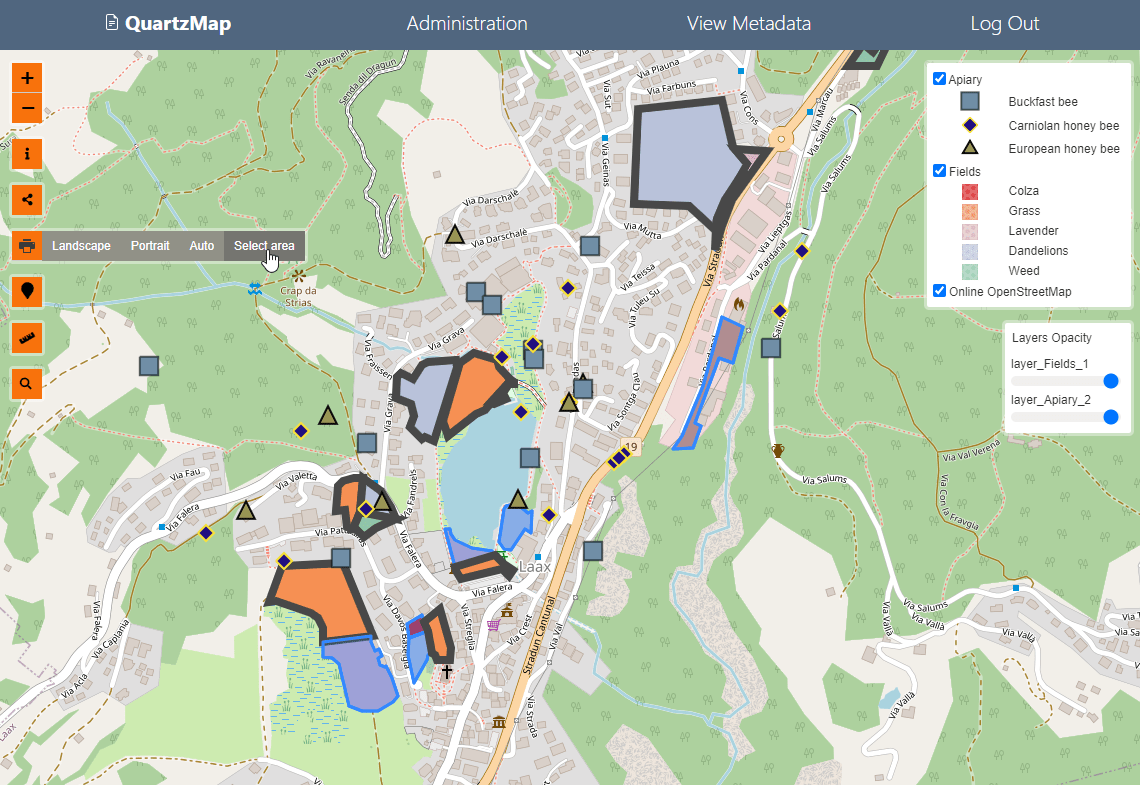
map-viewer
|
|
dashboard-builder
|
|
analysis-panel
|
|
dataset-tools
|
|
```
|
|
|
|
## Key Features
|
|
|
|
- **Responsive Design**: Works on desktop, tablet, and mobile
|
|
- **Dark Mode**: Optional dark theme support
|
|
- **Interactive Maps**: Pan, zoom, and query features
|
|
- **Real-time Updates**: Live data updates and filtering
|
|
- **Customizable Dashboards**: Build custom data dashboards
|
|
- **Analysis Tools**: Integrated analysis panel
|
|
|
|
## Related Documentation
|
|
|
|
- [Analysis Tools](../analysis-tools/index.md)
|
|
- [API Documentation](../api/index.md)
|
|
- [Architecture Overview](../architecture.md)
|
|
|
